Overview
An actionable insight uses a merchant's own data patterns to create a personalised recommendation that can directly improve a key metric.
My role
I championed end-to-end UX for this complex, data-driven project, which introduced a new component to Shopify. I mapped out the component's lifecycle and designed it working closely with content, data and product. I led stakeholder meetings and presented designs to drive alignment, and worked through concerns from UX, content, engineering, data and senior leaders across the Core and Growth orgs.
The team
UX (me)
End-to-end design of the new component, from sprint to shipped MVP.
Content strategist
Helped with content needs for the MVP, brainstormed ideas and gave feedback on the component and data viz.
3 data scientists
Provided the first two use cases to test, and answered how insights are created, when they appear and how accurate the data viz is.
Product manager
Aligned the goals and scope, gave fresh eyes on the work, and answered product questions, constraints and concerns.
3 engineers
Built the MVP with me, and answered engineering questions, constraints and concerns.
10+ stakeholders
Designers, content strategists, PMs, engineers and senior leaders from other teams, who gave feedback that shaped the feature.
Context and goal
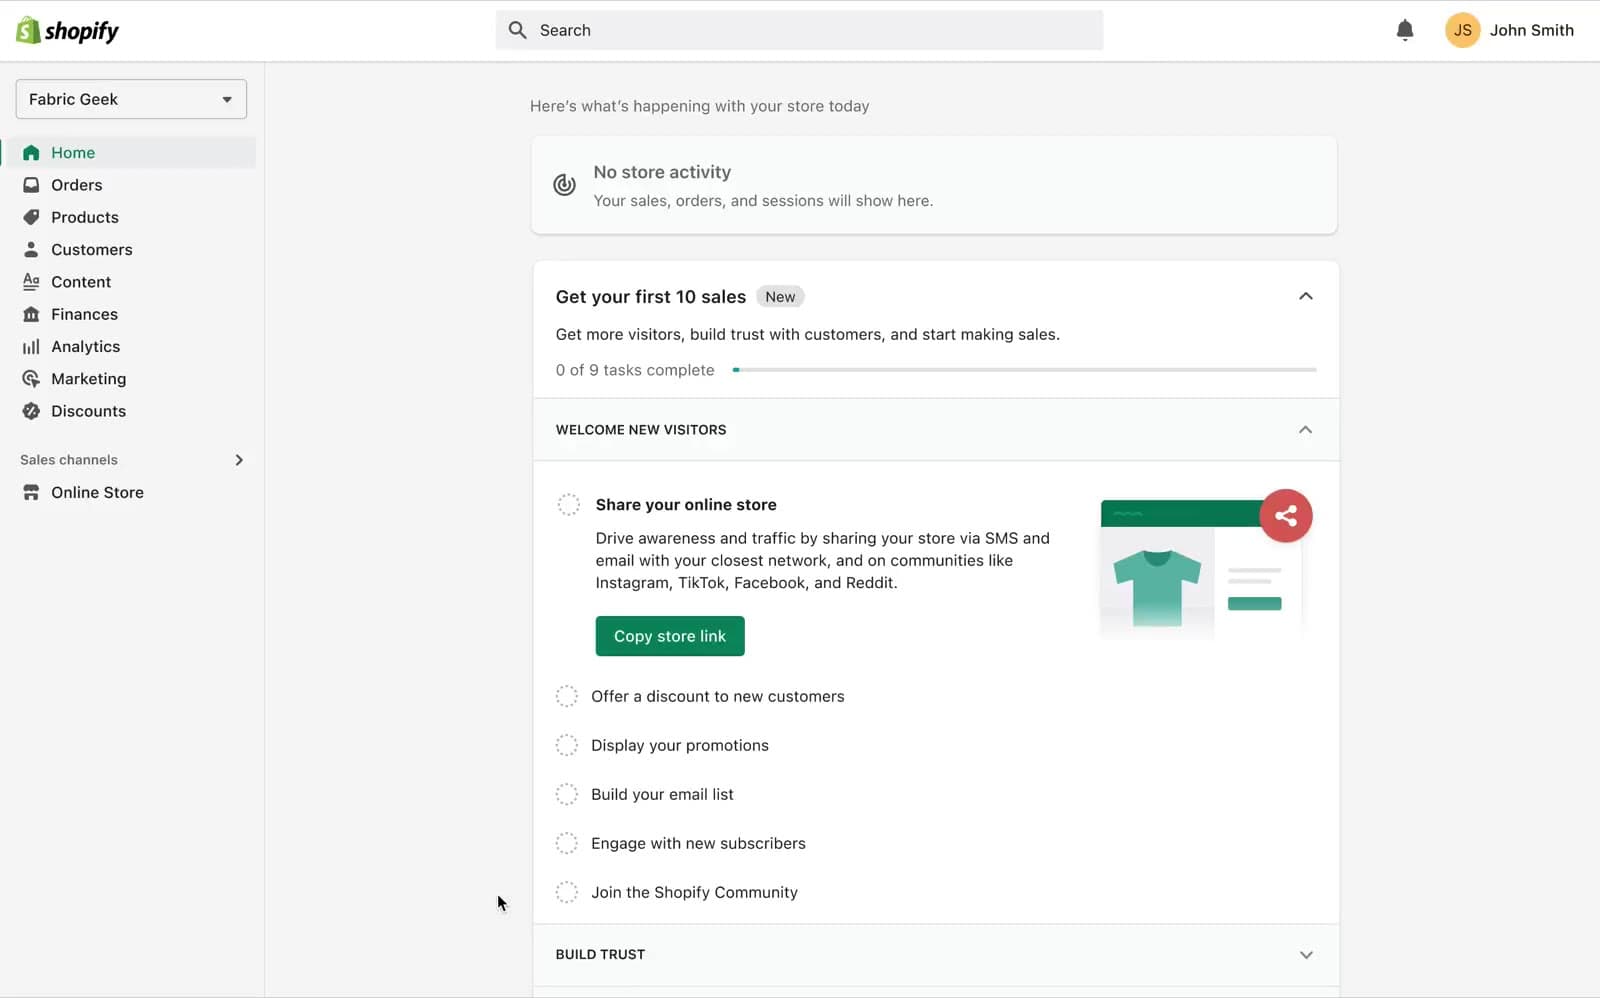
Existing merchants struggle to grow their businesses. The admin home was communicating too many things, the wrong things, or in the wrong way, when it should guide merchants towards actions that build their business. We planned to use actionable insights to make merchants more productive and cross-sell Shopify products that help them grow.
Goal
Use data and analysis to help merchants make informed decisions and act on them, and become the trusted source they turn to for the most impactful next steps on their journey.
- Intended outcomes
- Drive merchant success: improve the key metric and the driver metric tied to each insight.
- Surface highly relevant insights: engagement across insights, through CTAs and action completion.
- Build a new pattern that teams across Shopify can build on and experiment with long term, one that doesn't look like other home cards.
- Success criteria
- Primary: conversion rate and driver metric improvements.
- Secondary: action completion and dismiss rates.
- Constraints
- An MVP for a brand-new component.
- No custom Shopify report for each insight (learned later on).
- No custom data viz (learned late in exploration, from the Polaris viz team).
- Insights are a snapshot in time and don't update live.
Planning
Design sprint
We kicked off with a two-day on-site sprint, which helped the team move fast and share ideas. While the data team explored which insights to surface for early sellers, UX defined the parts of an actionable insight and started prototyping.
Segment
Who the insight is for.
Metric
The number it's about.
Trend or change
What moved, and by how much.
Reference
What to compare it against.
Action
The one thing to do next.
Feedback
- The "How does this work?" section would add a lot of scope.
- Does the graph provide value, or is it only decoration?
- The content needed to work harder to grab merchants' attention.
Two insights to test
The data team locked in two insights from the sprint, so UX could start on the content.
- Insight 1
- Add abandoned cart automation to reduce the abandoned cart rate. Key metric: conversion rate. Driver metric: abandoned cart rate.
- Insight 2
- Add Shop Pay to improve conversion rate.
Definition
Mapping the lifecycle
Taking a step back, I mapped the lifecycle of an actionable insight to define every state the component needed, and worked through open questions with the team.
Iteration
Iterating on data viz
We descoped the detailed view, and I focused the next iterations on the card's data viz, completed state and dismiss patterns.
I presented two UI options to the team and gathered feedback to improve the data viz.
Then I worked with the Shopify Core design team to find the right data viz, explored more UI and content options, and synced with senior leadership for alignment.
Iteration
Aligning with Polaris
Senior leadership shared the design with the Core team building all new data viz at Shopify, and I worked with them to align the component with Polaris viz guidelines. Their concerns:
- Data viz didn't add much value and shouldn't be used as illustration.
- Data viz should always show live data, not a snapshot in time.
- Polaris viz doesn't support custom data viz, so graphs should be descoped for V1.
- Custom reports couldn't be created yet, only linked, so reports should be descoped for V1.
The team pushed for a simplified graph with few data points, a line graph and no reports.
- UX
- A quick snapshot of the insight, with content strategy and lightweight data viz that encourage merchants to act. No links to reports in this version.
- Content strategy
- Mention the change in the driver metric conversationally in the heading.
- In the body, name the opportunity to improve the commerce metric, then briefly state the solution and outcome.
- A CTA to act, and data viz showing the % change in the key metric.
- Data viz
- Conversion data from only the first day of each of the last two months, not the whole month.
Decision
Key metric or driver metric
After a lot of back and forth on trade-offs, limitations and constraints with other teams, we collectively chose a text-only approach to the data viz.
That left one question: show the key metric or the driver metric? I wrote up the pros and cons of each to make the trade-offs clear and finalise the design.
We shipped option 2.
Final design
On the admin home, actionable insights always appear below the guides.
Outcome and learnings
Outcome
The MVP shipped. The insight card reached a 12–15% engagement rate, compared with 0.2% for other home cards.
Starting with unknowns
Getting comfortable starting a project with a lot of unknowns and assumptions.
Find stakeholders early
The sprint was rushed and we didn't identify the right stakeholders up front, so new ones joined every week with different opinions, leading to more iterations.
Take a stand
With many teams involved, you can't make everyone happy. At times UX has to evaluate trade-offs, take a stand and align on a design to ship.
Data viz
Learned how data visualisation works, and which styles (line, bar and more) suit which kinds of data.